Hyperuricemia (HUA) refers to chronic metabolic diseases caused by excessive production and (or) insufficient excretion of uric acid in the body under normal diet and caused by purine metabolic disorders, which can be divided into primary and secondary diseases. It is often accompanied by obesity, type 2 diabetes, lipid abnormalities and other metabolic syndrome.
Establishment of hyperuricemia mouse model by potassium oxyzinate and adenine


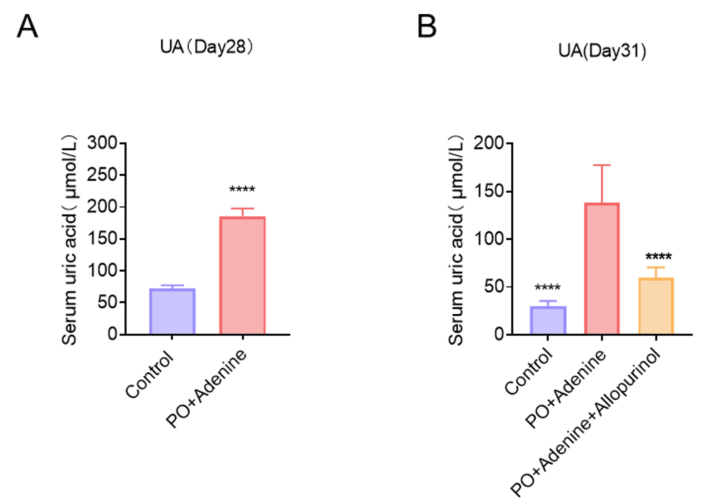
Fig.2 Establishment of hyperuricemia mouse model induced by PO and Adenine. (A) Serum uric acid were measured at days 28. (B) Serum uric acid levels measured at days 31. Values are means ±SEM from 6 mice/group. ****P <0.0001 vs. G2 group.

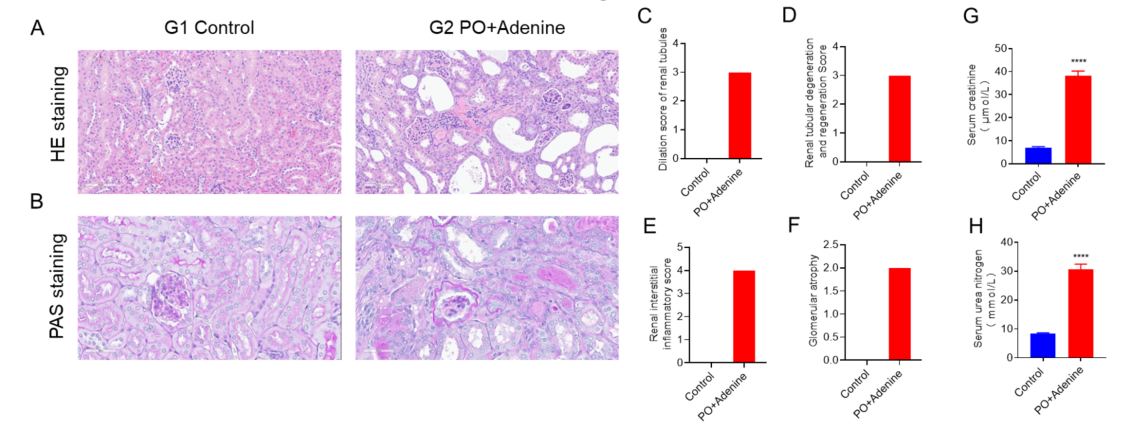
Fig.3 Establishment of uric acid nephropathy mouse model induced by PO and Adenine. (A) Representative pictures of HE staining show dilation, degeneration and regeneration of renal tubules, glomerular atrophy and renal interstitial inflammatory cell infiltration with fibroblast proliferation. Scale bar: 100 μm (B) Representative pictures of PAS staining show thickening of the Bowman capsule wall. Scale bar: 50 μm.(C-F) Statistic data of HE stainig. (G-H) Serum creatinine and urea nitrogen after induction.


 +86-10-56967680
 info@bbctg.com.cn